
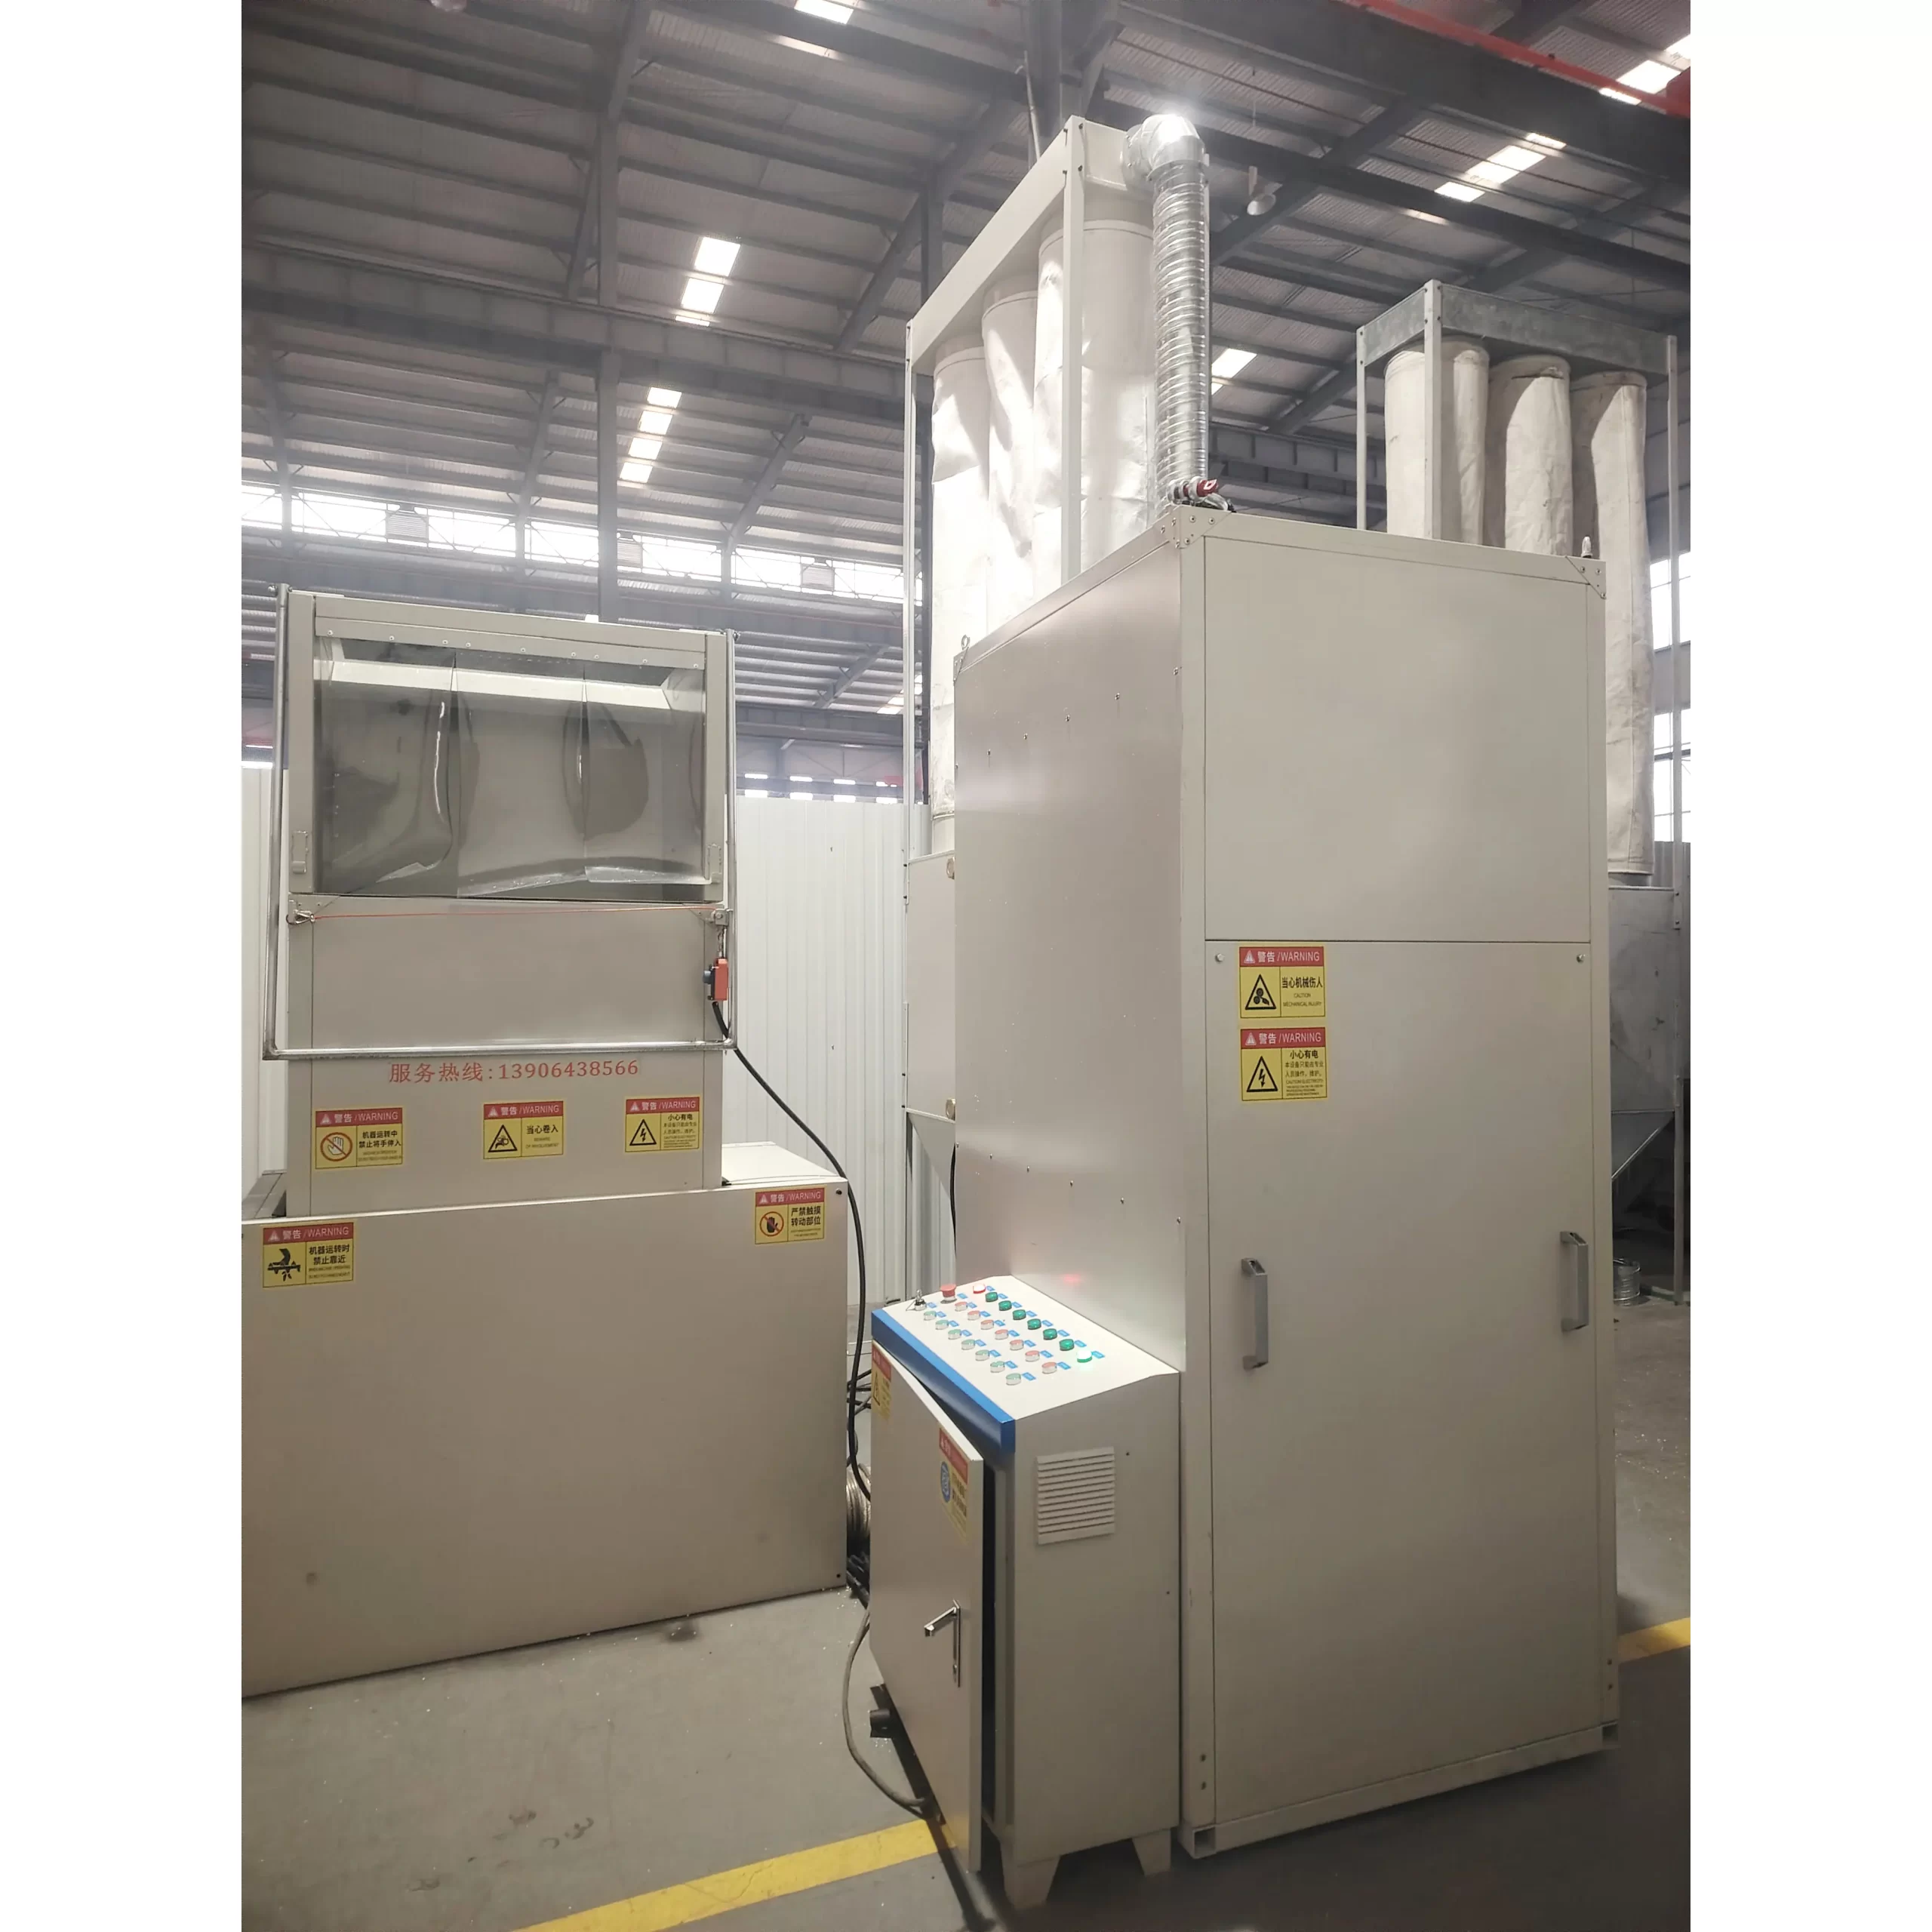
EPS recycling capital cost ranges $15,000 (manual crusher) to $250,000 (continuous automated line). Per-ton operating cost is $80–180 depending on energy, labor, and feedstock contamination. Recycled EPS pellet selling price in 2026 averages $320/ton in India, $280/ton in Indonesia, $340/ton in Brazil — generating gross margins of 35–55% on operating cost. Payback periods: 10–14 months for entry tier ($15K–$30K), 14–22 months for industrial tier ($80K–$250K). This buyer guide breaks down equipment investment, per-ton math, country-specific pricing, and the 5-point sourcing checklist for Chinese EPS recycling lines. Pair with our EPS recycling equipment and business guide for the process side, and our how to set up an EPS factory guide for full factory layout planning.
1. Why Buyers Are Asking About EPS Recycling Cost Now
Two market forces are converging in 2026 to make EPS recycling a high-priority investment for B2B manufacturers in emerging markets:
Regulatory pressure. Nigeria's 2027 EPS ban (single-use packaging), expanding EU EPR (Extended Producer Responsibility) schemes, and stricter Indian Plastic Waste Management Rules (2024 amendments) are pushing brand owners and packaging converters to demonstrate closed-loop recycling. The US EPA recycling guidelines and equivalent regional frameworks now require documented recovery rates for foam packaging streams.
Feedstock economics. Post-industrial EPS waste (manufacturing scrap, off-cuts, rejected blocks) costs $20–60/ton — versus virgin EPS resin at $1,500–1,800/ton FOB Asia. Recycled EPS pellets sell for $260–380/ton depending on cleanliness, blend ratio, and end-use specification. The arithmetic is straightforward: convert waste with negative or near-zero cost into pellets that sell for 4–8× equipment opex.
India's recycled-EPS market alone has grown from 18,000 tons in 2023 to an estimated 45,000 tons in 2026 (5.8% CAGR for cellular foam recycling broadly per IEA petrochemical trend data). Indonesia and Brazil are tracking similar growth curves as municipal recycling infrastructure expands. The EPRO European plastics recycling association tracks parallel growth in EU member states driven by EPR enforcement, and the ASTM D1621 standard defines the compressive properties recycled-EPS pellets must hit for re-use in foam-grade applications.
ChinaEps factory note (Jiangyin recycling integration): At our Jiangyin site we operate a closed-loop recycling line that absorbs 100% of EPS manufacturing scrap from our adjacent BM-1400 block production. The combined economics work out at $42/ton net feedstock cost (vs $25–55/ton for external waste purchasers). Our experience exporting recycling lines to 60+ countries — heavily concentrated in India, Indonesia, and Brazil — confirms the per-ton math in Section 3 below: payback consistently lands within the 10–18 month band when feedstock is post-industrial (manufacturing scrap), and 16–24 months when feedstock is post-consumer (collected packaging waste).
Illustrative Calculation — Not a Universal Guarantee
The prices, payback periods, and ROI numbers below use assumed inputs for raw-material cost, electricity, steam, labor, tariffs, sale price, and factory utilization. Actual results vary significantly by country and site. Send your local cost inputs to info@chinaeps.net for a country-specific model.
2. EPS Recycling Equipment Cost — 3 Investment Tiers
Equipment investment splits cleanly into three tiers based on output capacity and automation level. The decision is not "which is best" but "which matches your feedstock volume and labor cost structure."
| Tier | Output (kg/hr) | CapEx | Equipment | Best for |
|---|---|---|---|---|
| Entry ($15K–$30K) | 50–150 | $15,000–30,000 | Manual crusher + cold compactor (RE600 class) | <500 ton/year, low labor cost (India tier-2 cities, Indonesia secondary) |
| Mid ($45K–$90K) | 200–400 | $45,000–90,000 | Auto crusher + de-duster + hot compactor (RE900) + mixer | 500–1500 ton/year, mid-size packaging converter |
| Industrial ($120K–$250K) | 500–1500 | $120,000–250,000 | Continuous shredder + magnetic separator + densifier + pelletizer + cooling | 1500+ ton/year, dedicated recycling plant or large OEM |
Add 12–20% for installation, electrical hookup, dust extraction, and operator training. Factory footprint: 80–150 m² (entry), 250–400 m² (mid), 600–1000 m² (industrial). For equipment selection methodology beyond cost see our EPS machine buying guide: 8 questions before you order from China — the verification framework applies directly to recycling equipment.
3. Per-Ton Operating Cost Math
Operating cost per ton of finished recycled EPS pellet has four major components: feedstock acquisition, electricity, labor, and consumables/maintenance. Here is the breakdown for a representative mid-tier line operating in India (Pune metro area, 2026 pricing):
| Cost Component | Per Ton (USD) | Notes |
|---|---|---|
| Feedstock (post-industrial EPS waste) | $25–55 | $20/ton at gate (manufacturing scrap) to $60/ton (collected from converters) |
| Electricity (0.25–0.40 kWh/kg) | $22–48 | India industrial rate $0.08–0.12/kWh; densification stage is the biggest draw |
| Labor (1.5–3 operators per shift) | $18–35 | $3.50–8/hour fully loaded India; lower if family-run operation |
| Consumables + maintenance | $10–25 | Cutting blades, filters, lubricants; budget 8–12% of capex annually |
| Packaging + freight (intra-country) | $8–18 | 25 kg bags or 500 kg bulk sacks; depends on destination |
| Total OpEx per ton | $83–181 | Mid-point ~$120/ton for typical India operation |
At a selling price of $320/ton (India 2026 average for recycled EPS pellet, mixed-grade), gross margin ranges 44–74% on OpEx — strong even at the high-cost end. For Indonesia and Brazil, adjust electricity ($0.10–0.14/kWh and $0.13–0.18/kWh respectively) and labor (Indonesia lower, Brazil higher).
4. Country Pricing — India, Indonesia, Brazil, China (2026)
Recycled EPS pellet pricing varies significantly by market based on local virgin EPS pricing, regulatory environment, and end-user industry mix. These are FOB-equivalent prices for medium-quality recycled pellet (75% recycled content, suitable for non-food packaging) in Q2 2026:
| Market | Sell Price ($/ton) | Main Buyers | Notes |
|---|---|---|---|
| India (Pune, Chennai, Mumbai) | $300–360 | Packaging converters, ice-box makers, construction (ICF mix) | Largest market by volume; growing 8–10%/year |
| Indonesia (Jakarta, Surabaya) | $260–310 | Fish packaging, fruit logistics, electronics inserts | Tight margins; high-purity sells at premium |
| Brazil (São Paulo, Curitiba) | $320–380 | Construction (ICF, void fill), packaging, automotive 2nd-tier | Strong demand; ABNT certification needed for construction use |
| China (domestic resale) | $260–320 | Re-export to SEA, internal packaging supply | Highest volume globally; competitive due to scale |
| Vietnam (Ho Chi Minh, Hanoi) | $280–340 | Electronics packaging, fish boxes, construction | Emerging market; demand growing 12-15%/year |
Pricing assumes mid-quality recycled pellet with melt flow index 8–14 g/10 min, ash content <0.5%, moisture <0.3%. Higher-purity pellets (recycled content 50–60%, food-contact qualified) command 25–40% premium. Lower-grade densified scrap (for non-foam applications like construction filler) trades at $150–220/ton.
5. Payback Period by Tier
Combining CapEx, OpEx, output volume, and sell price gives the payback period — the single most important metric for B2B investment decision-makers. Here are payback ranges for the three equipment tiers, assuming India 2026 economics with 75% capacity utilization:
| Tier | CapEx | Annual Output (ton) | Annual Gross Profit | Payback |
|---|---|---|---|---|
| Entry | $22,500 (mid) | 180–360 | $28K–58K | 10–14 months |
| Mid | $67,500 (mid) | 720–1,440 | $80K–158K | 14–18 months |
| Industrial | $185,000 (mid) | 1,800–5,400 | $170K–540K | 14–22 months |
Payback is shortest for entry-tier where labor is cheap (manual operations dominate cost structure), and longest for industrial-tier where higher automation requires utilization above 60% to amortize the capital. Brazil and Indonesia projects typically run 20–35% longer payback than India equivalents due to higher labor or lower pellet prices respectively.
For a worked example using a different production model, see our EPS machine ROI calculation guide — the formula structure transfers directly to recycling equipment.
6. Hidden Cost Risks (Read Before You Buy)
The published ROI math assumes everything goes right. In practice, four hidden costs blow up budgets if not factored in advance:
- Feedstock contamination tax. If incoming EPS waste contains >3% contamination (cardboard, plastic film, tape residue), output pellet quality drops one grade and sells at 20–30% discount. Budget $4–12/ton for manual sorting or a magnetic+optical separation upgrade.
- Density transport penalty. Raw EPS waste is 95% air. Without on-site densification, you pay shipping cost on bulk volume — sometimes $40–80/ton just to truck unprocessed scrap 200 km. The cold compactor or densifier is non-negotiable for any operation pulling feedstock from multiple suppliers.
- Local certification. Brazil's ABNT, India's BIS, Indonesia's SNI may require formal pellet certification before sale to large buyers (food-grade packaging converters, large construction firms). Budget 6–12 months and $3K–8K for first-time certification per market.
- Equipment downtime cost. A single broken granulator blade or jammed densifier can halt production for 2–5 days. Recycling-line downtime costs $1.5–4K/day in lost margin. Stock 2–3 weeks of consumables minimum.
7. 5-Point China Sourcing Checklist
China supplies approximately 70% of global EPS recycling equipment exports. Pricing is highly competitive ($15K–$250K versus $40K–$500K for German equivalents) but quality varies dramatically. Use this 5-point checklist when sourcing:
- Throughput verification. Insist on factory acceptance testing (FAT) with your actual feedstock sample. Catalog throughput numbers are measured with optimal-conditions virgin EPS scrap; real waste streams run 60–80% of catalog rates.
- Densification ratio. Output bulk density should be 30:1 versus input (input ~15 g/L, output ~450 g/L for densified). Lower ratios indicate undersize densifier or worn screws.
- Energy specification. Verified kWh/kg in real production, not lab conditions. Should be 0.25–0.40 kWh/kg for densification; numbers below 0.20 are usually false advertising.
- After-sales engineering hours. Confirm at least 5 days on-site commissioning included, plus 12 months remote troubleshooting. Reputable suppliers will commit to 48-hour parts dispatch for critical wear items.
- Reference customers. Ask for 3 reference customers in your target region (India, Indonesia, Brazil, etc.) and verify them independently. Avoid suppliers who can only show domestic-China references — export operations face different feedstock and regulatory conditions.
For the broader Chinese-supplier verification methodology, see our EPS machine buying guide with 8 questions. The framework adapts directly to recycling equipment with the additional specifications above.
8. Frequently Asked Questions
How much does it cost to recycle 1 ton of EPS?
Operating cost is $80–180 per ton depending on country (electricity, labor) and feedstock condition. Mid-point is approximately $120/ton for an India operation with mid-tier equipment. Capital amortization adds $15–40/ton depending on equipment tier and utilization rate.
What is the payback period for EPS recycling equipment?
Payback ranges 10–22 months in 2026: 10–14 months for entry tier ($15K–$30K CapEx), 14–18 months for mid tier ($45K–$90K), and 14–22 months for industrial tier ($120K–$250K). Brazil and Indonesia projects run 20–35% longer payback than India due to higher labor or lower pellet pricing.
How much does recycled EPS sell for per ton in India in 2026?
Recycled EPS pellet sells for $300–360/ton in India for mid-quality (75% recycled content, non-food applications). Higher-purity pellets command 25–40% premium ($380–500/ton). Lower-grade densified scrap (construction filler) trades at $150–220/ton.
What is the minimum equipment for EPS recycling startup?
Minimum viable equipment is a manual crusher ($5K–8K) plus a cold compactor like the RE600 class ($8K–15K) — total $15K–25K for 50–150 kg/hr output. This serves operations up to 500 ton/year. Above that volume, mid or industrial tier becomes economically necessary.
Is EPS recycling profitable in Indonesia?
Yes, with appropriate scale. Indonesia 2026 sell prices ($260–310/ton) are 10–15% below India but operating costs are also lower (cheaper labor, similar electricity). Net margins remain healthy at 30–45%. Payback typically 12–18 months for mid-tier equipment.
What is the difference between cold compactor and densifier?
Cold compactor reduces EPS volume mechanically (compression only) — typical 50:1 reduction at $8K–25K cost. Densifier uses friction heat plus pressure to melt-bond EPS into solid logs or pellets — typical 90:1 reduction, higher quality output, $30K–80K cost. Cold compactor suits transport-only operations; densifier suits operations selling to converters who melt the output.
Can recycled EPS be used in food packaging?
Generally no for direct food contact. Recycled EPS is widely used in non-food packaging (electronics inserts, cushioning, ice boxes), construction (ICF blends, void fill), and industrial dunnage. Food-contact recycled EPS exists but requires specialized cleaning, certified suppliers, and 50–60% maximum recycled content blend with virgin.
What feedstock works best for EPS recycling?
Best feedstock is post-industrial EPS waste (manufacturing scrap, off-cuts, rejected blocks) — typically 95–99% pure, low contamination, available in consistent volumes. Post-consumer EPS (used fish boxes, packaging from end-users) is more challenging due to contamination, tape residue, and variable cleanliness. Mixed sources work but require additional sorting investment.
How is recycled EPS pellet quality measured?
Four key quality metrics: (1) melt flow index 8–14 g/10 min for general packaging, (2) ash content <0.5%, (3) moisture <0.3%, and (4) color uniformity (white preferred, grey acceptable for non-visible applications). Buyers will request quality certificates for each lot. Failed lots typically downgrade to densified-scrap pricing ($150–220/ton).
Can I retrofit an existing EPS factory with a recycling line?
Yes, and this is the most common entry path. An existing EPS production factory generates 5–15% scrap (off-cuts, rejected blocks, pre-expander rejects) that becomes free or near-free feedstock for an attached recycling line. Closed-loop integration typically pays back in 6–10 months — significantly faster than greenfield recycling startups. See our EPS factory setup guide for layout planning.
Related Reading
- EPS Recycling: 3 Methods + Equipment Guide (ROI in 14 Months) — Process-side companion guide with method comparison.
- How to Set Up an EPS Factory — Full factory layout planning for closed-loop integration.
- EPS Machine Buying Guide: 8 Questions Before You Order from China — Verification framework applies to recycling equipment.
- EPS Machine ROI: 14–22 Month Payback — ROI calculation methodology with worked example.
- Global EPS Supply Realignment 2026 — Why regulatory pressure is driving recycling investment now.
- Closed-Loop EPS Recycling System: How In-House Scrap-to-Bead Recovery Works — Extended reading in the same cluster.