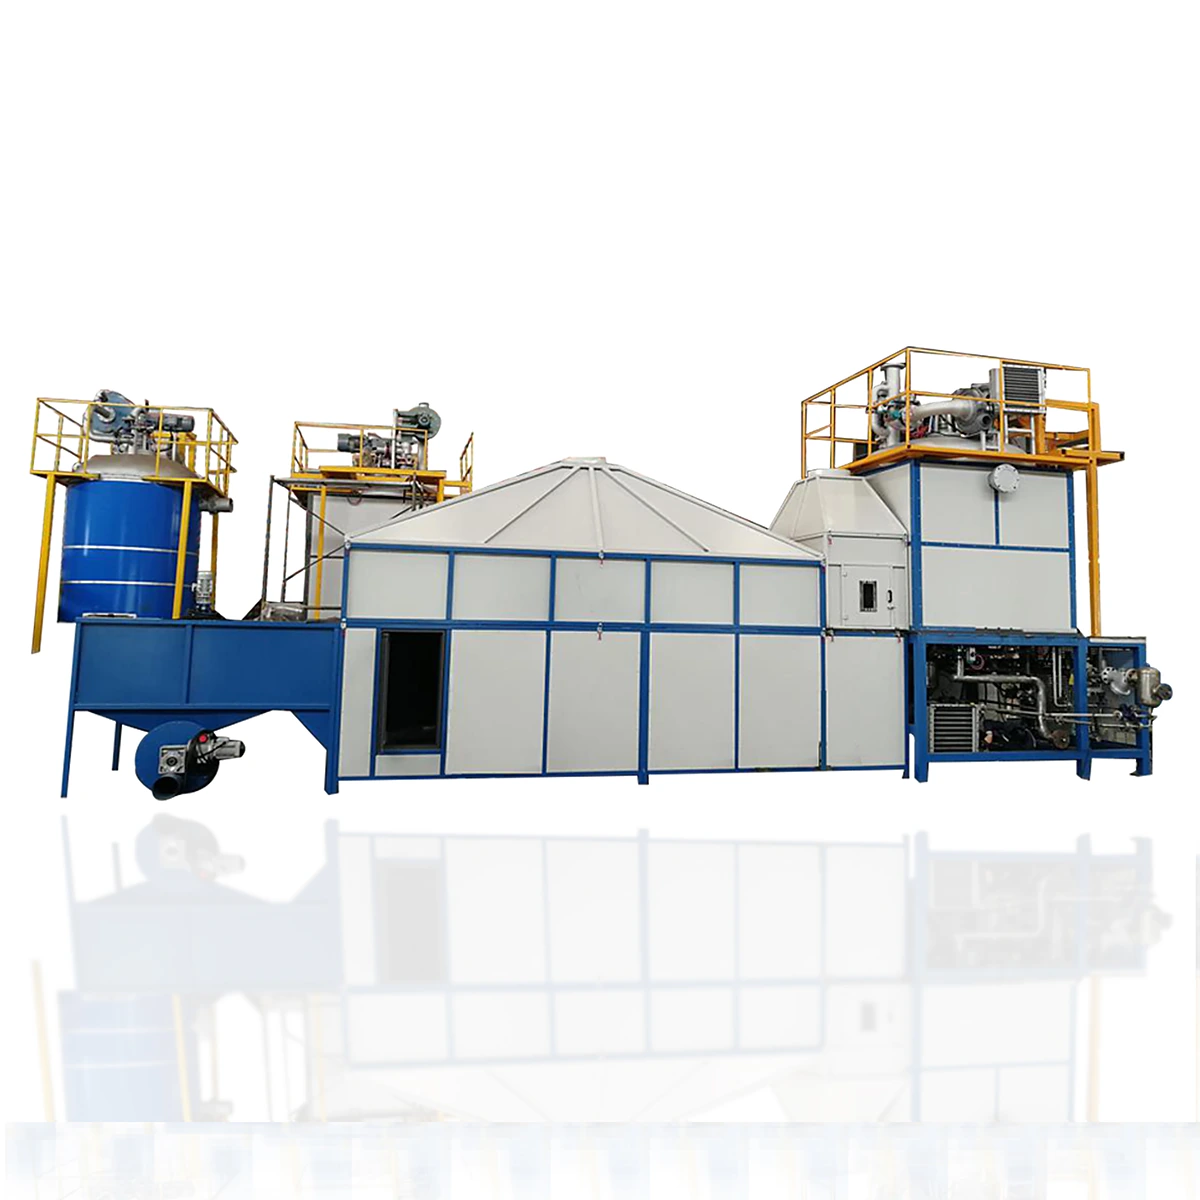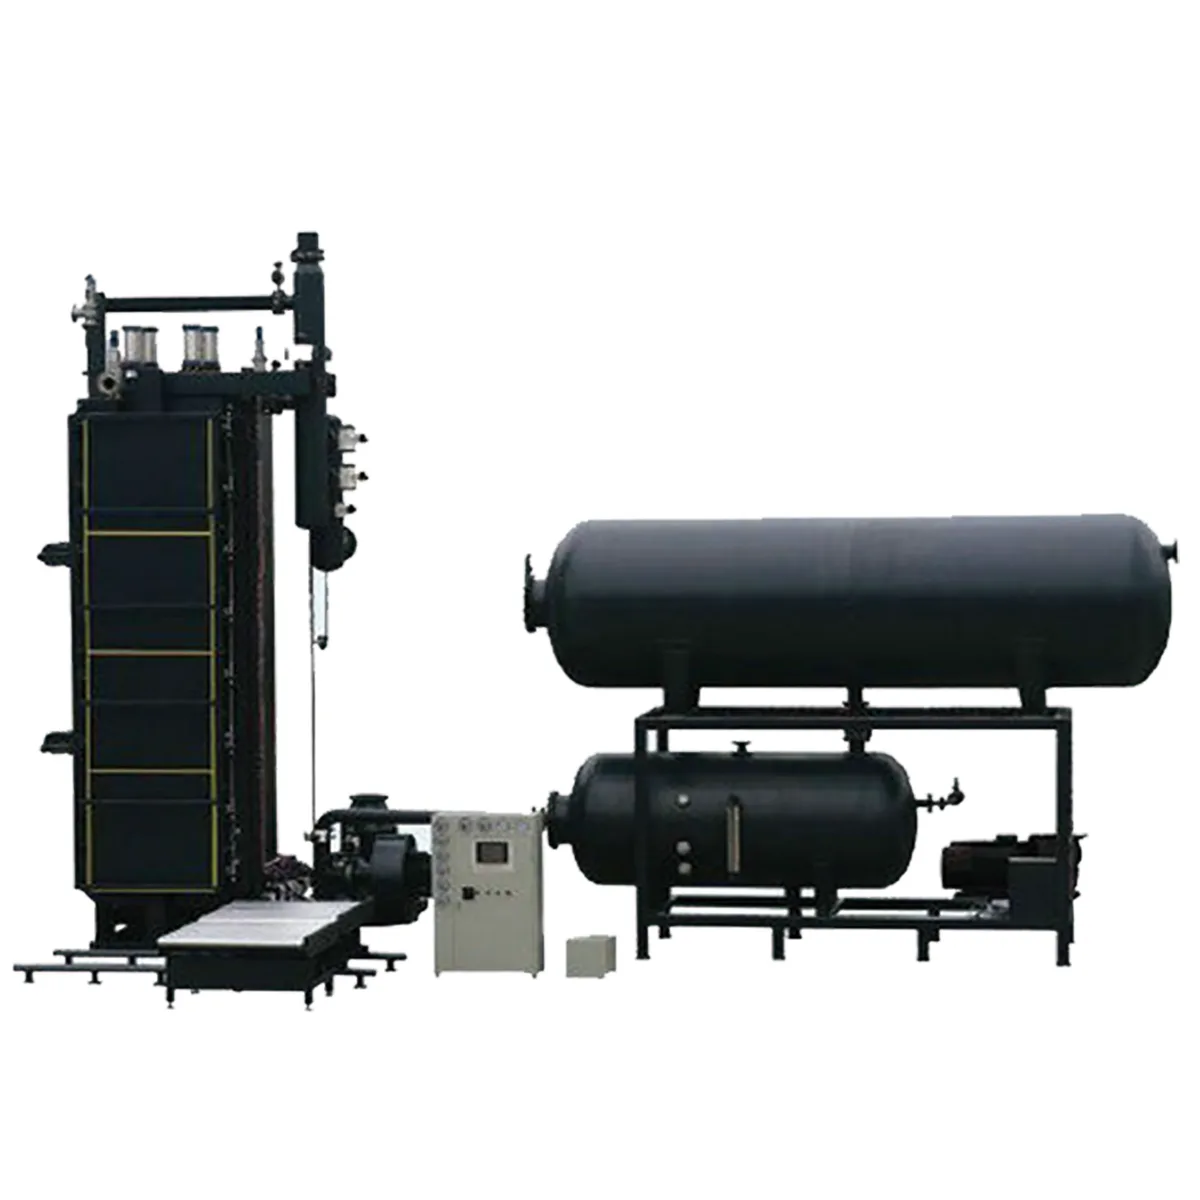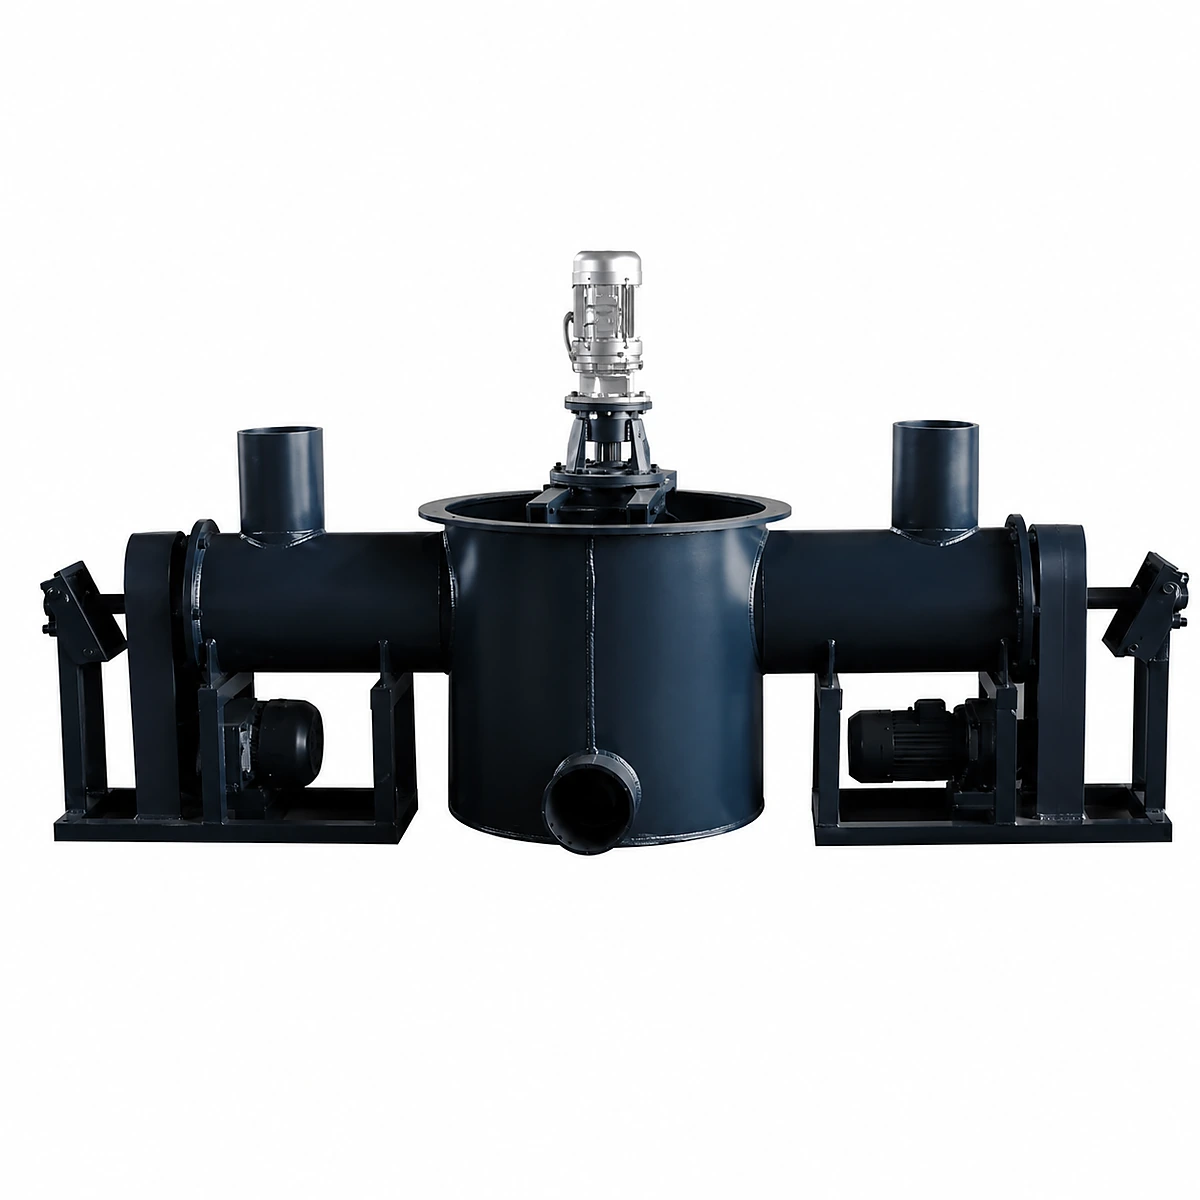
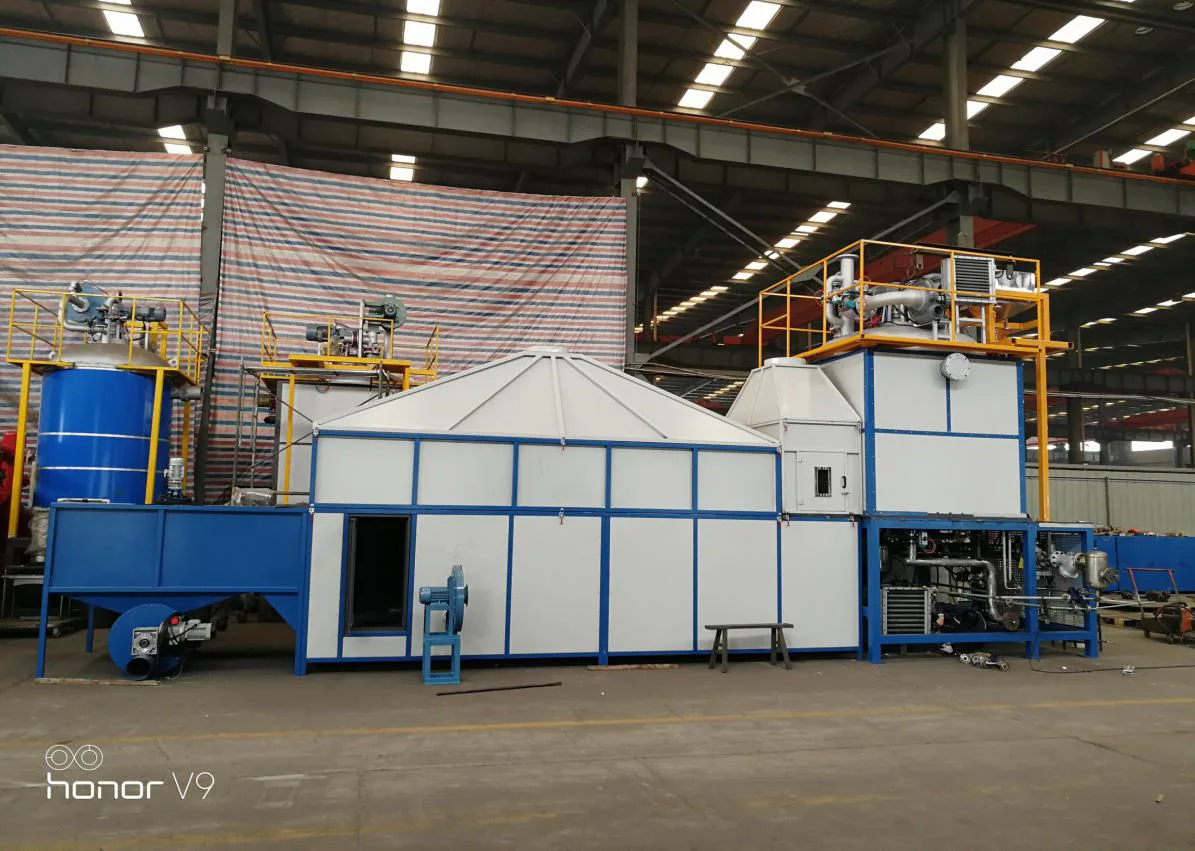
Annual EPS machine maintenance cost runs 4-8% of equipment capital cost per year, or roughly $8,000-$40,000/year for a mid-tier line ($200K capex). Breakdown: preventive maintenance labor 30-40%, wear parts 25-35%, unplanned downtime 15-25%, utility overhead 10-15%. Unplanned downtime is the biggest hidden cost — $2,000-$5,000/day for mid-line, $5,000-$12,000/day for industrial-line. A well-executed preventive maintenance program (daily 15 min + weekly 2 hr + monthly 4 hr + annual 2 days) cuts total maintenance spend by 35-45% and cuts unplanned downtime by 60-70%. This buyer guide breaks down cost per component tier, gives you the annual budget calculator formula, and shows which spare parts must be stocked on-site versus which can be JIT-ordered. Pair with our EPS maintenance technical guide for the how-to procedures, and EPS machine buying guide for capex context.
1. Why Maintenance Cost Deserves Its Own Line Item
For B2B buyers evaluating EPS machinery, capex dominates the purchase-decision conversation — FOB price, landed cost, financing terms. That conversation typically stops the moment the equipment is on-site. The mistake: total 10-year ownership cost is 40-70% capex and 30-60% maintenance + downtime. Ignore maintenance economics, and your 14-month payback projection turns into 24 months of surprise invoices.
Three market forces are pushing maintenance cost into the buyer conversation in 2026:
- Labor cost inflation. India tier-2 city maintenance-engineer wages rose 40% between 2022-2026. Indonesia and Vietnam followed. Labor now dominates preventive maintenance cost in every LATAM and Asian market.
- Parts lead-time volatility. Post-COVID supply chains stabilized in 2024, but Chinese-parts logistics still show 25-40% cost swings quarter to quarter. Spare parts inventory holding cost is up.
- Energy-cost integration. Steam and electricity waste from poorly maintained pre-expanders and block molders now accounts for a documented 5-15% of factory OpEx per the US DOE steam-systems guidance. Maintenance and utility bills are increasingly the same conversation.
The buyers who win in 2026 are the ones who negotiate spare-parts price locks, on-site training hours, and predictive-maintenance software terms into the original purchase contract. That negotiation requires knowing the numbers. This guide gives them to you.
2. Annual Maintenance Cost Breakdown by Component
For a representative Mid-tier EPS production line ($200K capex, 800-1,500 ton/year output), here is the annual maintenance cost breakdown in 2026 pricing (India factory economics; adjust ±25% for Indonesia, ±40% for Brazil):
| Cost Component | % of Total | Annual USD (Mid line) | Driver |
|---|---|---|---|
| Preventive maintenance labor | 30-40% | $4,800-$8,000 | 2-3 in-house technicians × 15-20 hr/week |
| Wear parts (routine) | 25-35% | $4,000-$7,000 | Cutting wires, heating elements, vacuum seals, filters |
| Unplanned downtime cost | 15-25% | $2,400-$5,000 | Rejected batches + urgent-repair labor + lost margin |
| Utility overhead (waste) | 10-15% | $1,600-$3,000 | Steam leaks, uncalibrated valves, worn insulation |
| Software / diagnostics | 3-8% | $500-$1,600 | PLC updates, HMI licensing, remote diagnostics |
| Third-party service calls | 3-7% | $500-$1,400 | OEM technician dispatch (dispatch fee + travel + day rate) |
| Total annual maintenance | 100% | $13,800-$26,000 | Mid-point ~$18,000/year for $200K line |
The Industrial tier ($350K capex, 2,500-5,000 ton/year) runs $28,000-$56,000/year in annual maintenance — roughly 8-16% of capex — because the automation and PLC layer adds diagnostic-software and specialized-technician cost that the Mid tier doesn't carry.
ChinaEps factory note (3 sites: Jiangyin / Wenzhou / Dongguan): Across our 60+ export markets, we consistently see the same pattern: buyers who spec out their maintenance budget at purchase time end up spending 35-45% less over 10 years than buyers who "figure it out after commissioning." The gap comes from three moves — locking spare-parts prices for 24 months on the original contract, negotiating training hours as a delivery deliverable (not a paid extra), and specifying remote-diagnostics access at day one. All three are contract clauses. All three are free at negotiation and expensive later.
3. Unplanned Downtime — The Cost Hidden in Plain Sight
The single largest hidden cost in EPS operations is unplanned downtime — hours or days when the line stops because something failed that preventive maintenance should have caught. For a Mid-tier line running at 75% capacity utilization, one lost day carries:
| Loss Component | Per Day Impact |
|---|---|
| Lost production margin (rejected blocks + skipped batches) | $1,200-$2,800 |
| Emergency repair labor (2-3× standard rate) | $400-$900 |
| Rush parts shipment (air freight vs. sea) | $200-$800 |
| Customer late-delivery penalties / goodwill | $0-$2,500 (deal-dependent) |
| Total per unplanned downtime day | $1,800-$7,000 |
Mid-tier lines without a structured preventive-maintenance program typically log 12-20 unplanned downtime days per year. That is $21,000-$140,000 in annual hidden cost — often exceeding the entire visible maintenance budget. Lines with mature preventive-maintenance programs log 3-6 unplanned days per year — a 60-70% reduction confirming what the industry-standard maintenance handbooks report per the OSHA machine-guarding guidance on scheduled inspections.
4. Preventive Maintenance Schedule and Labor Cost
A structured preventive-maintenance schedule for a Mid-tier EPS line requires approximately 320-480 labor hours per year across four cadences. Here is what each cadence covers and the annual labor cost implication:
| Cadence | Duration | Annual Hours | Key Tasks |
|---|---|---|---|
| Daily | 15 min | ~90 hr | Visual checks, pressure gauges, temperature logs, lubrication top-ups |
| Weekly | 2 hr | ~104 hr | Steam trap inspection, filter cleaning, safety-interlock test, vacuum-seal check |
| Monthly | 4 hr | ~48 hr | Full valve calibration, hydraulic-fluid analysis, PLC alarm-log review, motor bearing check |
| Quarterly | 1 day (8 hr) | ~32 hr | Steam-line pressure test, mold-plate flatness check, cooling-tower descale, HMI backup |
| Annual | 2 days (16 hr) | ~16 hr | Full line calibration, wear-parts replacement, hydraulic-oil change, PLC firmware update, safety audit |
| Total per year | - | ~290 hr | Approx 1 FTE across in-house team |
At India tier-2 city rates ($10-$18/hr fully loaded for a maintenance engineer), annual preventive-maintenance labor cost is $2,900-$5,200. At Indonesian rates ($7-$14/hr) it is $2,000-$4,100. At Brazilian rates ($22-$40/hr) it is $6,400-$11,600. Labor is the single largest maintenance-cost variable across markets — capex-per-ton comparison at purchase time is deceiving if you do not layer in local maintenance labor economics.
5. Spare Parts — Stock vs. JIT Decision Matrix
Which spare parts to hold on-site and which to source just-in-time is the single most consequential maintenance-inventory decision. Get it wrong in the "stock" direction and you tie up 8-12% of capex value in shelf inventory. Get it wrong in the "JIT" direction and one broken cutting wire costs you three days of downtime waiting for air freight.
| Part Category | Stock or JIT? | Reason | Cost Impact if Absent |
|---|---|---|---|
| Cutting wires (hot-wire) | STOCK 6-month supply | High failure frequency, low unit cost, 2-4 week freight | $1,800-$5,000/day downtime |
| Heating elements (pre-expander, molder) | STOCK 2 units per line | Predictable ~18-month lifespan, $200-$600/unit | $2,500-$6,000/day downtime |
| Vacuum seals | STOCK 12-month supply | Consumable, high failure, low cost | $1,200-$3,000/day downtime |
| Steam-valve seats | STOCK 3-month supply | Wear item, moderate cost | $1,000-$2,500/day downtime |
| Hydraulic seals + cylinders | STOCK critical sizes only | Long parts, expensive; predictable through oil analysis | $3,000-$8,000/day downtime |
| PLC control boards | JIT + supplier commitment | Expensive, low failure rate, 4-8 week manufacture | $5,000-$12,000/day downtime (if urgent) |
| Motor / servo drives | JIT + supplier commitment | Expensive, 6-12 month lifespan predictable | $4,000-$10,000/day downtime |
| Mold plates | JIT via 3D digital library | Made-to-order, 8-16 week lead | Product-specific — cost varies wildly |
| Frame / structural parts | NEVER STOCK | Rarely fails; local welding fabrication when needed | $500-$1,500 one-time repair |
The optimal on-site spare-parts inventory value for a Mid-tier line is $16,000-$28,000 (8-14% of capex). Below $10,000 you are gambling on JIT for high-frequency parts. Above $35,000 you are holding cost in items that either rarely fail or can be sourced within a week.
6. Annual Maintenance Budget Calculator
The formula for calculating your annual EPS-line maintenance budget is straightforward once you have the four inputs. Compute each column below and sum:
| Input | Formula | Mid-Tier Example |
|---|---|---|
| Capex-linked baseline | Equipment capex × 5% | $200,000 × 5% = $10,000 |
| Labor (preventive maintenance) | PM annual hours × local fully-loaded rate | 290 hr × $14/hr (India) = $4,060 |
| Downtime buffer | Line daily margin × 5 days | $1,500 × 5 = $7,500 |
| Spare-parts inventory holding | On-site inventory × 15% (holding cost) | $22,000 × 15% = $3,300 |
| Annual budget total | Sum | $24,860/year |
For a $200K Mid-tier line in India economics, the calculator produces $24,860/year — roughly 12% of capex, at the higher end of the 4-8% published rule-of-thumb because it includes a realistic downtime-buffer allocation and inventory-holding cost that most rules of thumb hide. This higher number is the honest one.
Interactive Budget Calculator (Adjust for Your Line)
Estimate Your Line's Annual Maintenance Cost
Enter your line's specifications below. All figures use 2026 pricing and validated industry benchmarks.
Estimated annual maintenance cost:
$24,860
≈ 12.4% of capex per year
• Capex baseline (5%): $10,000
• PM labor: $4,060
• Downtime buffer: $7,500
• Spares inventory holding (15%): $3,300
This calculator gives a directional estimate based on industry-benchmark inputs. For a line-specific quote reflecting your actual downtime history, spare-parts consumption, and local labor cost, request a maintenance-cost audit from the ChinaEps engineering team.
7. Region-Specific Maintenance Economics
The Mid-tier baseline above assumes India economics. Here is how the annual maintenance cost shifts across the major EPS export markets we serve:
| Region | Labor Multiplier | Parts Multiplier | Downtime Cost Multiplier | Annual (Mid Line, USD) |
|---|---|---|---|---|
| India (baseline) | 1.0× | 1.0× | 1.0× | $24,000-$26,000 |
| Indonesia | 0.65× | 1.1× | 0.85× | $19,500-$21,500 |
| Vietnam | 0.75× | 1.05× | 0.9× | $21,000-$23,000 |
| Brazil | 2.2× | 1.35× | 1.5× | $46,000-$52,000 |
| Mexico | 1.8× | 1.15× | 1.3× | $36,000-$40,000 |
| UAE / Saudi Arabia | 1.4× | 1.05× | 1.1× | $28,000-$32,000 |
| Nigeria | 0.85× | 1.6× | 1.4× | $28,000-$33,000 |
| Poland / Eastern EU | 1.6× | 1.0× | 1.2× | $32,000-$36,000 |
Note the pattern: Brazil is 2× India on total maintenance economics, driven mostly by high labor cost and long parts lead-times from Chinese suppliers. UAE and Saudi Arabia are middle-of-pack because parts logistics via DP World and Jebel Ali are efficient. Nigeria's parts multiplier is the highest in our data because of import-clearance costs and duty layering — even though labor is cheap.
8. 10-Year Total Cost of Ownership
The buyer decision that matters is 10-year TCO, not annual. Here is what the numbers look like for a $200K Mid-tier line across the 10-year window, comparing a mature preventive-maintenance program versus reactive "fix it when it breaks" maintenance:
| Cost Element | Reactive Maintenance | Preventive Maintenance | 10-Year Difference |
|---|---|---|---|
| Capex (year 0) | $200,000 | $200,000 | $0 |
| Annual maintenance (× 10) | $14,000 × 10 = $140,000 | $24,000 × 10 = $240,000 | +$100,000 |
| Unplanned downtime cost (× 10) | 15 days/yr × $4,000 × 10 = $600,000 | 4 days/yr × $4,000 × 10 = $160,000 | -$440,000 |
| Major mid-life refit (year 6) | $85,000 | $35,000 | -$50,000 |
| Resale value (end of year 10) | $30,000 (worn) | $70,000 (maintained) | +$40,000 |
| 10-year TCO | $995,000 | $565,000 | -$430,000 |
Preventive maintenance saves $430,000 over 10 years on a $200,000 capex investment — a 3.4× return on the extra $100K spent on structured maintenance. The math is unusually strong; it is also unusually well-documented in industry data. The remaining question is not "should we do preventive maintenance" but "how do we resource it" — see Section 4 for the labor-hours breakdown and Section 5 for the spare-parts decision matrix.
9. Frequently Asked Questions
What percentage of capex should I budget for annual maintenance?
Budget 4-8% of capex per year for a Mid-tier line running a mature preventive-maintenance program. Industrial-tier lines with automation and PLC layers run 8-16% of capex per year. If you are running reactive-only maintenance, budget an additional 4-6 percentage points to cover unplanned-downtime cost, bringing the effective total to 10-18% of capex.
How much does one day of unplanned EPS-line downtime cost?
Mid-tier line: $1,800-$7,000 per day depending on production volume and customer-penalty exposure. Industrial line: $5,000-$12,000 per day. The largest hidden component is customer late-delivery penalties or goodwill damage, which varies by contract but is often larger than the direct lost-production cost.
Which spare parts must I keep in on-site inventory?
Stock a 6-month supply of cutting wires, 2 spare heating elements per line, 12-month supply of vacuum seals, and 3-month supply of steam-valve seats. JIT-source PLC boards, motor drives, and mold plates. Never inventory frame or structural parts. Target on-site inventory value is 8-14% of capex.
How many hours of preventive maintenance does a Mid-tier EPS line need per year?
Approximately 290 hours per year across daily (15 min × 250 workdays), weekly (2 hr × 52), monthly (4 hr × 12), quarterly (8 hr × 4), and annual (16 hr) cadences. This is roughly one FTE across a maintenance team split with other production duties.
Can remote-diagnostics software reduce maintenance cost?
Yes, materially. Chinese EPS suppliers increasingly offer PLC-integrated remote-diagnostics that let the OEM engineering team troubleshoot from Jiangsu without dispatching a technician. Typical cost savings: 40-60% reduction in third-party service calls, 20-30% reduction in average time-to-diagnosis. Insist on remote-access provisioning at the original purchase contract.
How does maintenance cost change if I run two shifts vs. one?
Non-linear. Two-shift operation raises annual PM labor cost by roughly 40-60% (not 100%) because inspection cadence increases but many tasks remain calendar-based. Wear-parts cost roughly doubles. Downtime cost roughly doubles because production hours-at-risk doubles. Total annual maintenance rises approximately 70-80% moving from one to two shifts.
Should I negotiate a maintenance service contract with the OEM?
For Industrial-tier lines with automation, yes — a 3-year OEM service contract typically costs 2-4% of capex per year and covers scheduled inspections, remote diagnostics, and priority parts dispatch. For Mid-tier lines, an OEM contract is usually overkill; local maintenance labor plus a spare-parts price lock is the more economical structure.
How much does mold-plate maintenance and replacement cost?
Mold plates are the highest-variance maintenance cost. A single mold plate refit (surface polishing, minor repair) costs $800-$2,500. Full mold-plate replacement runs $8,000-$35,000 depending on size and complexity. Mold-plate lifespan is 3-8 years for standard products, 1-3 years for high-density or flame-retardant grades where thermal cycling is more severe.
What is the maintenance cost difference between Chinese and European EPS equipment?
Chinese equipment: 4-8% of capex annually. European equipment: 3-6% of capex annually (lower parts failure rate, more predictable lifespan). But European after-sales technician dispatch costs 4-6× more per visit ($1,500-$2,500/day plus travel vs. $250-$500/day for Chinese-supplier technicians). Net TCO across 10 years is typically 15-30% lower for Chinese equipment when factoring both maintenance and after-sales.
How do I benchmark my maintenance cost against the industry?
Three benchmarks: (1) Maintenance cost as % of capex — Mid-tier should hit 4-8%; (2) Unplanned downtime days per year — should be under 5 for mature programs; (3) Spare-parts inventory value as % of capex — should be 8-14%. If any of these three drift outside range for more than two quarters, run a maintenance audit. For deeper technical benchmarking see our EPS maintenance technical guide and EPS quality-control defects guide.
Related Reading
- EPS Block Molding Machine Maintenance: Cut Downtime 60% (Full Schedule) — Technical companion covering the how-to of preventive-maintenance procedures.
- EPS Machine Buying Guide: 8 Questions Before You Order from China — Capex-side context; negotiate maintenance terms into the original purchase contract.
- EPS Factory Line Price by Country: 2026 Pricing — Regional cost baselines that flow into maintenance economics.
- EPS Machine ROI: 14-22 Month Payback — Frame maintenance cost within the full ROI calculation.
- EPS Quality Control: 7 Common Defects & How to Fix Them — Preventive-maintenance rigor is the first line of defense against production defects.