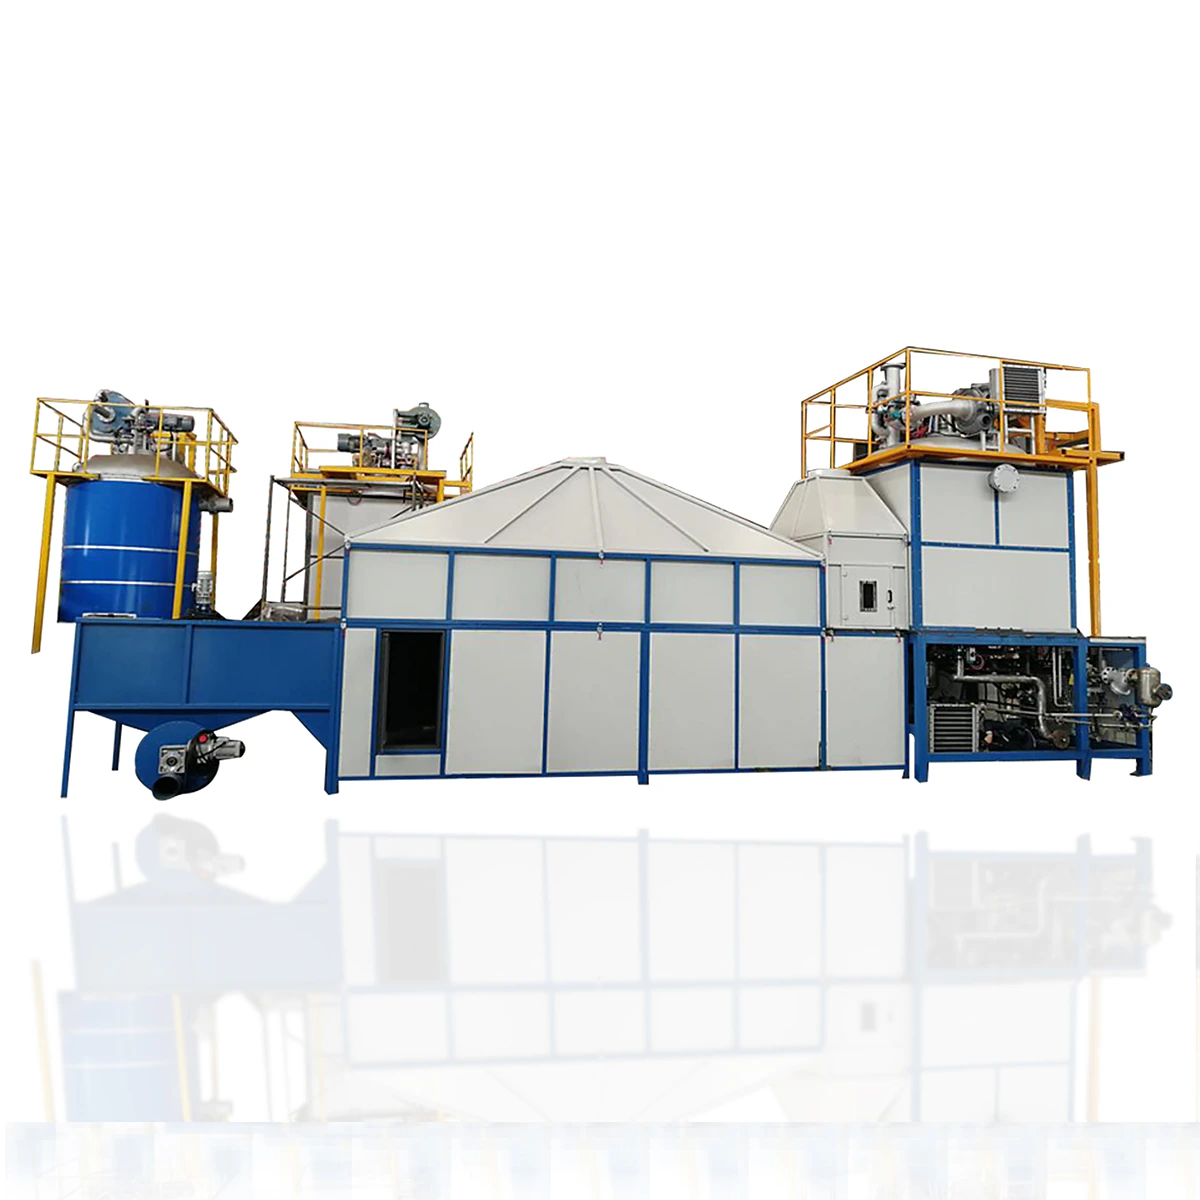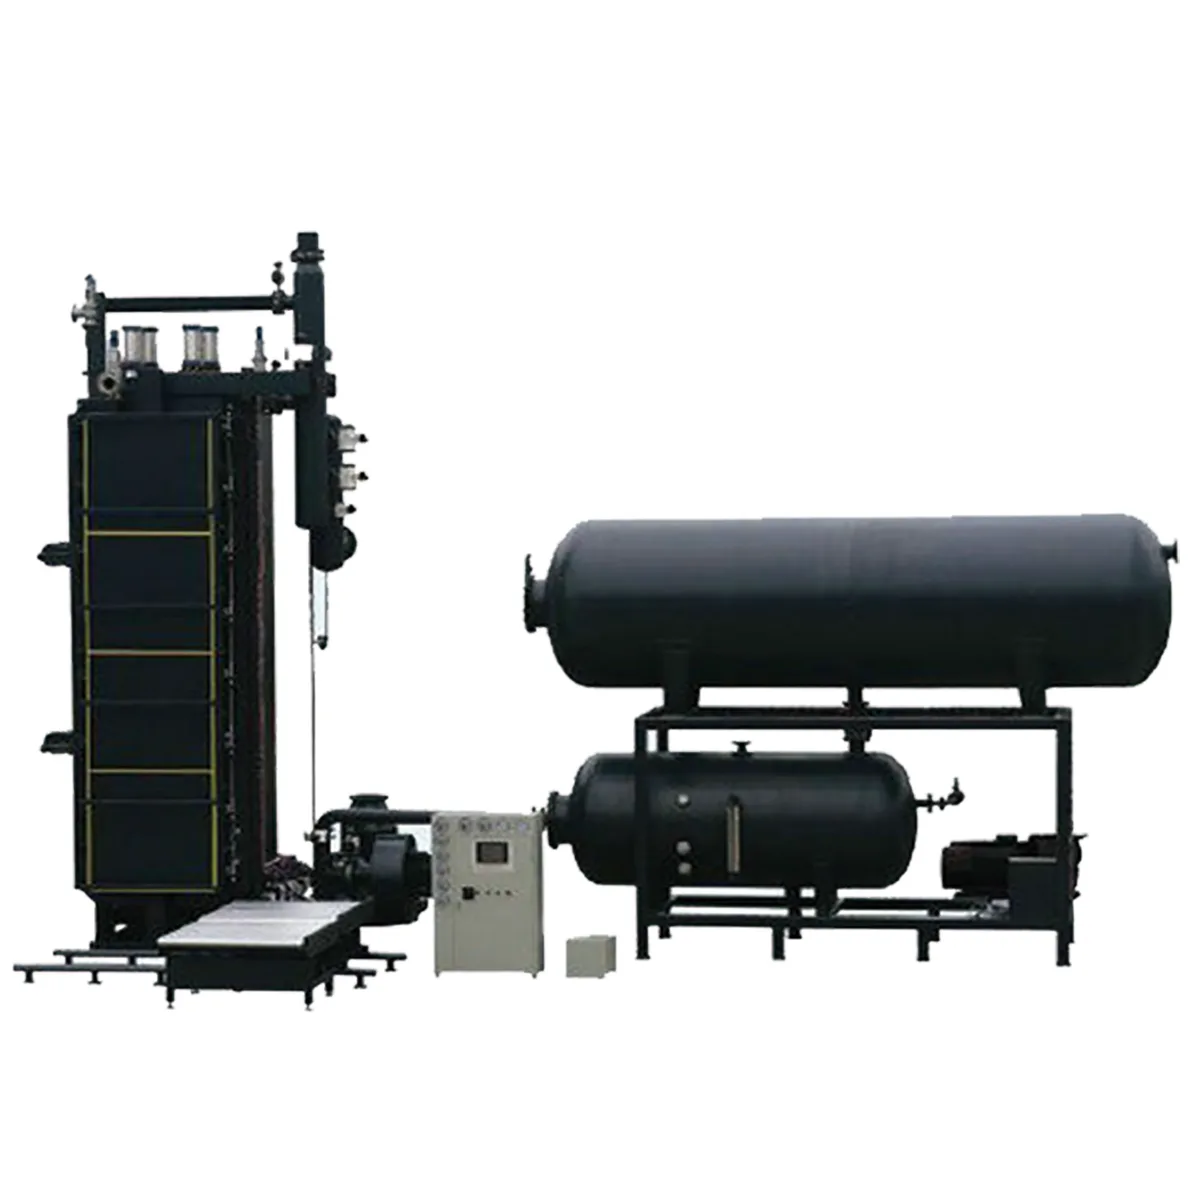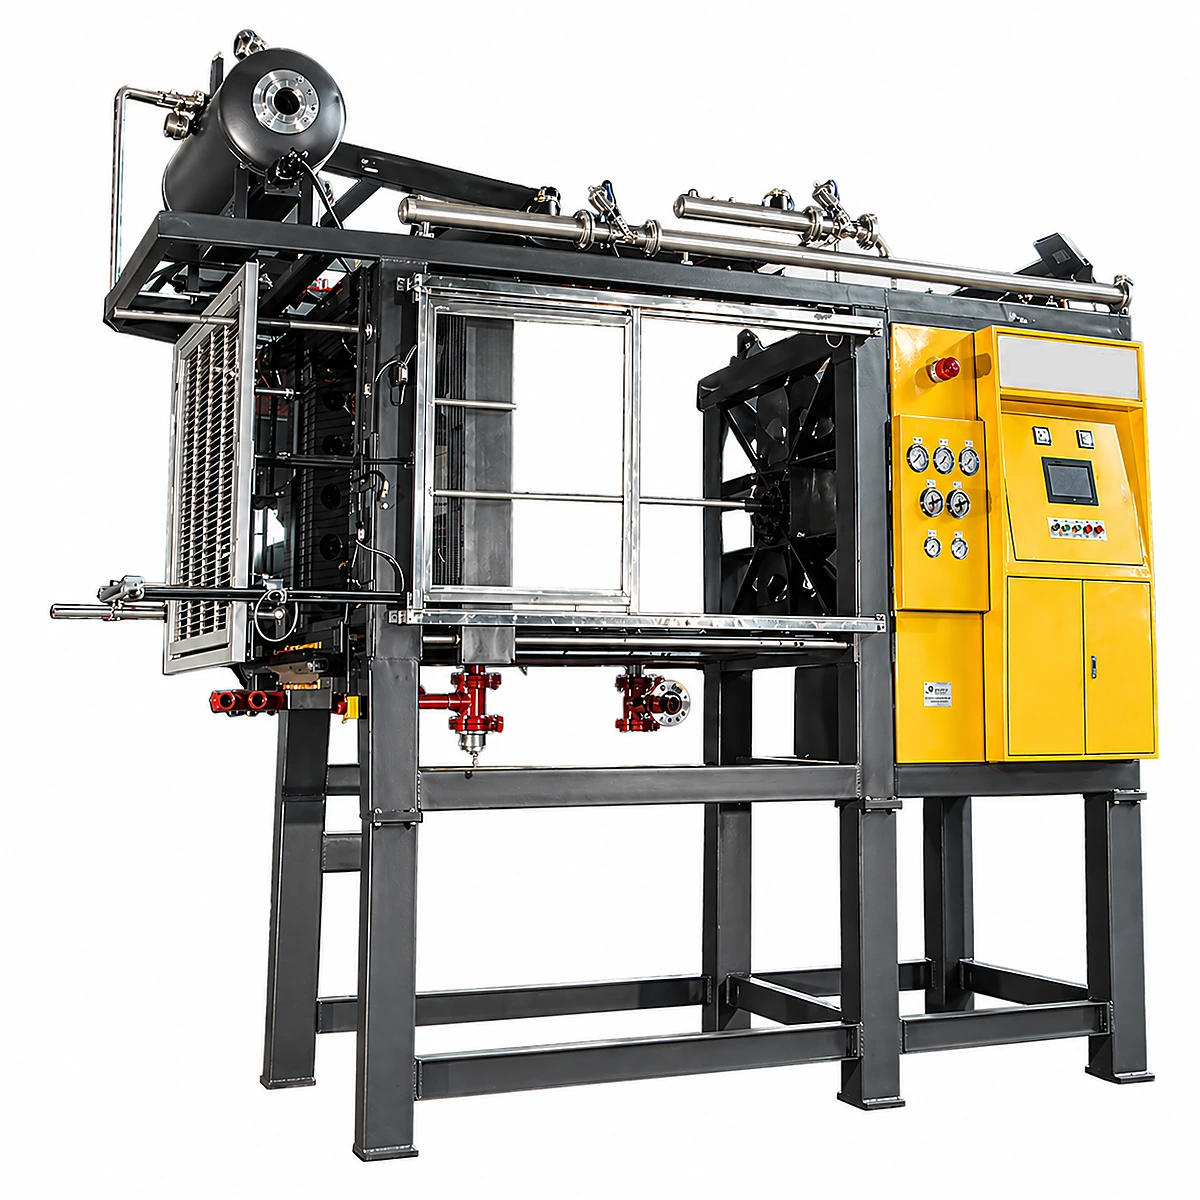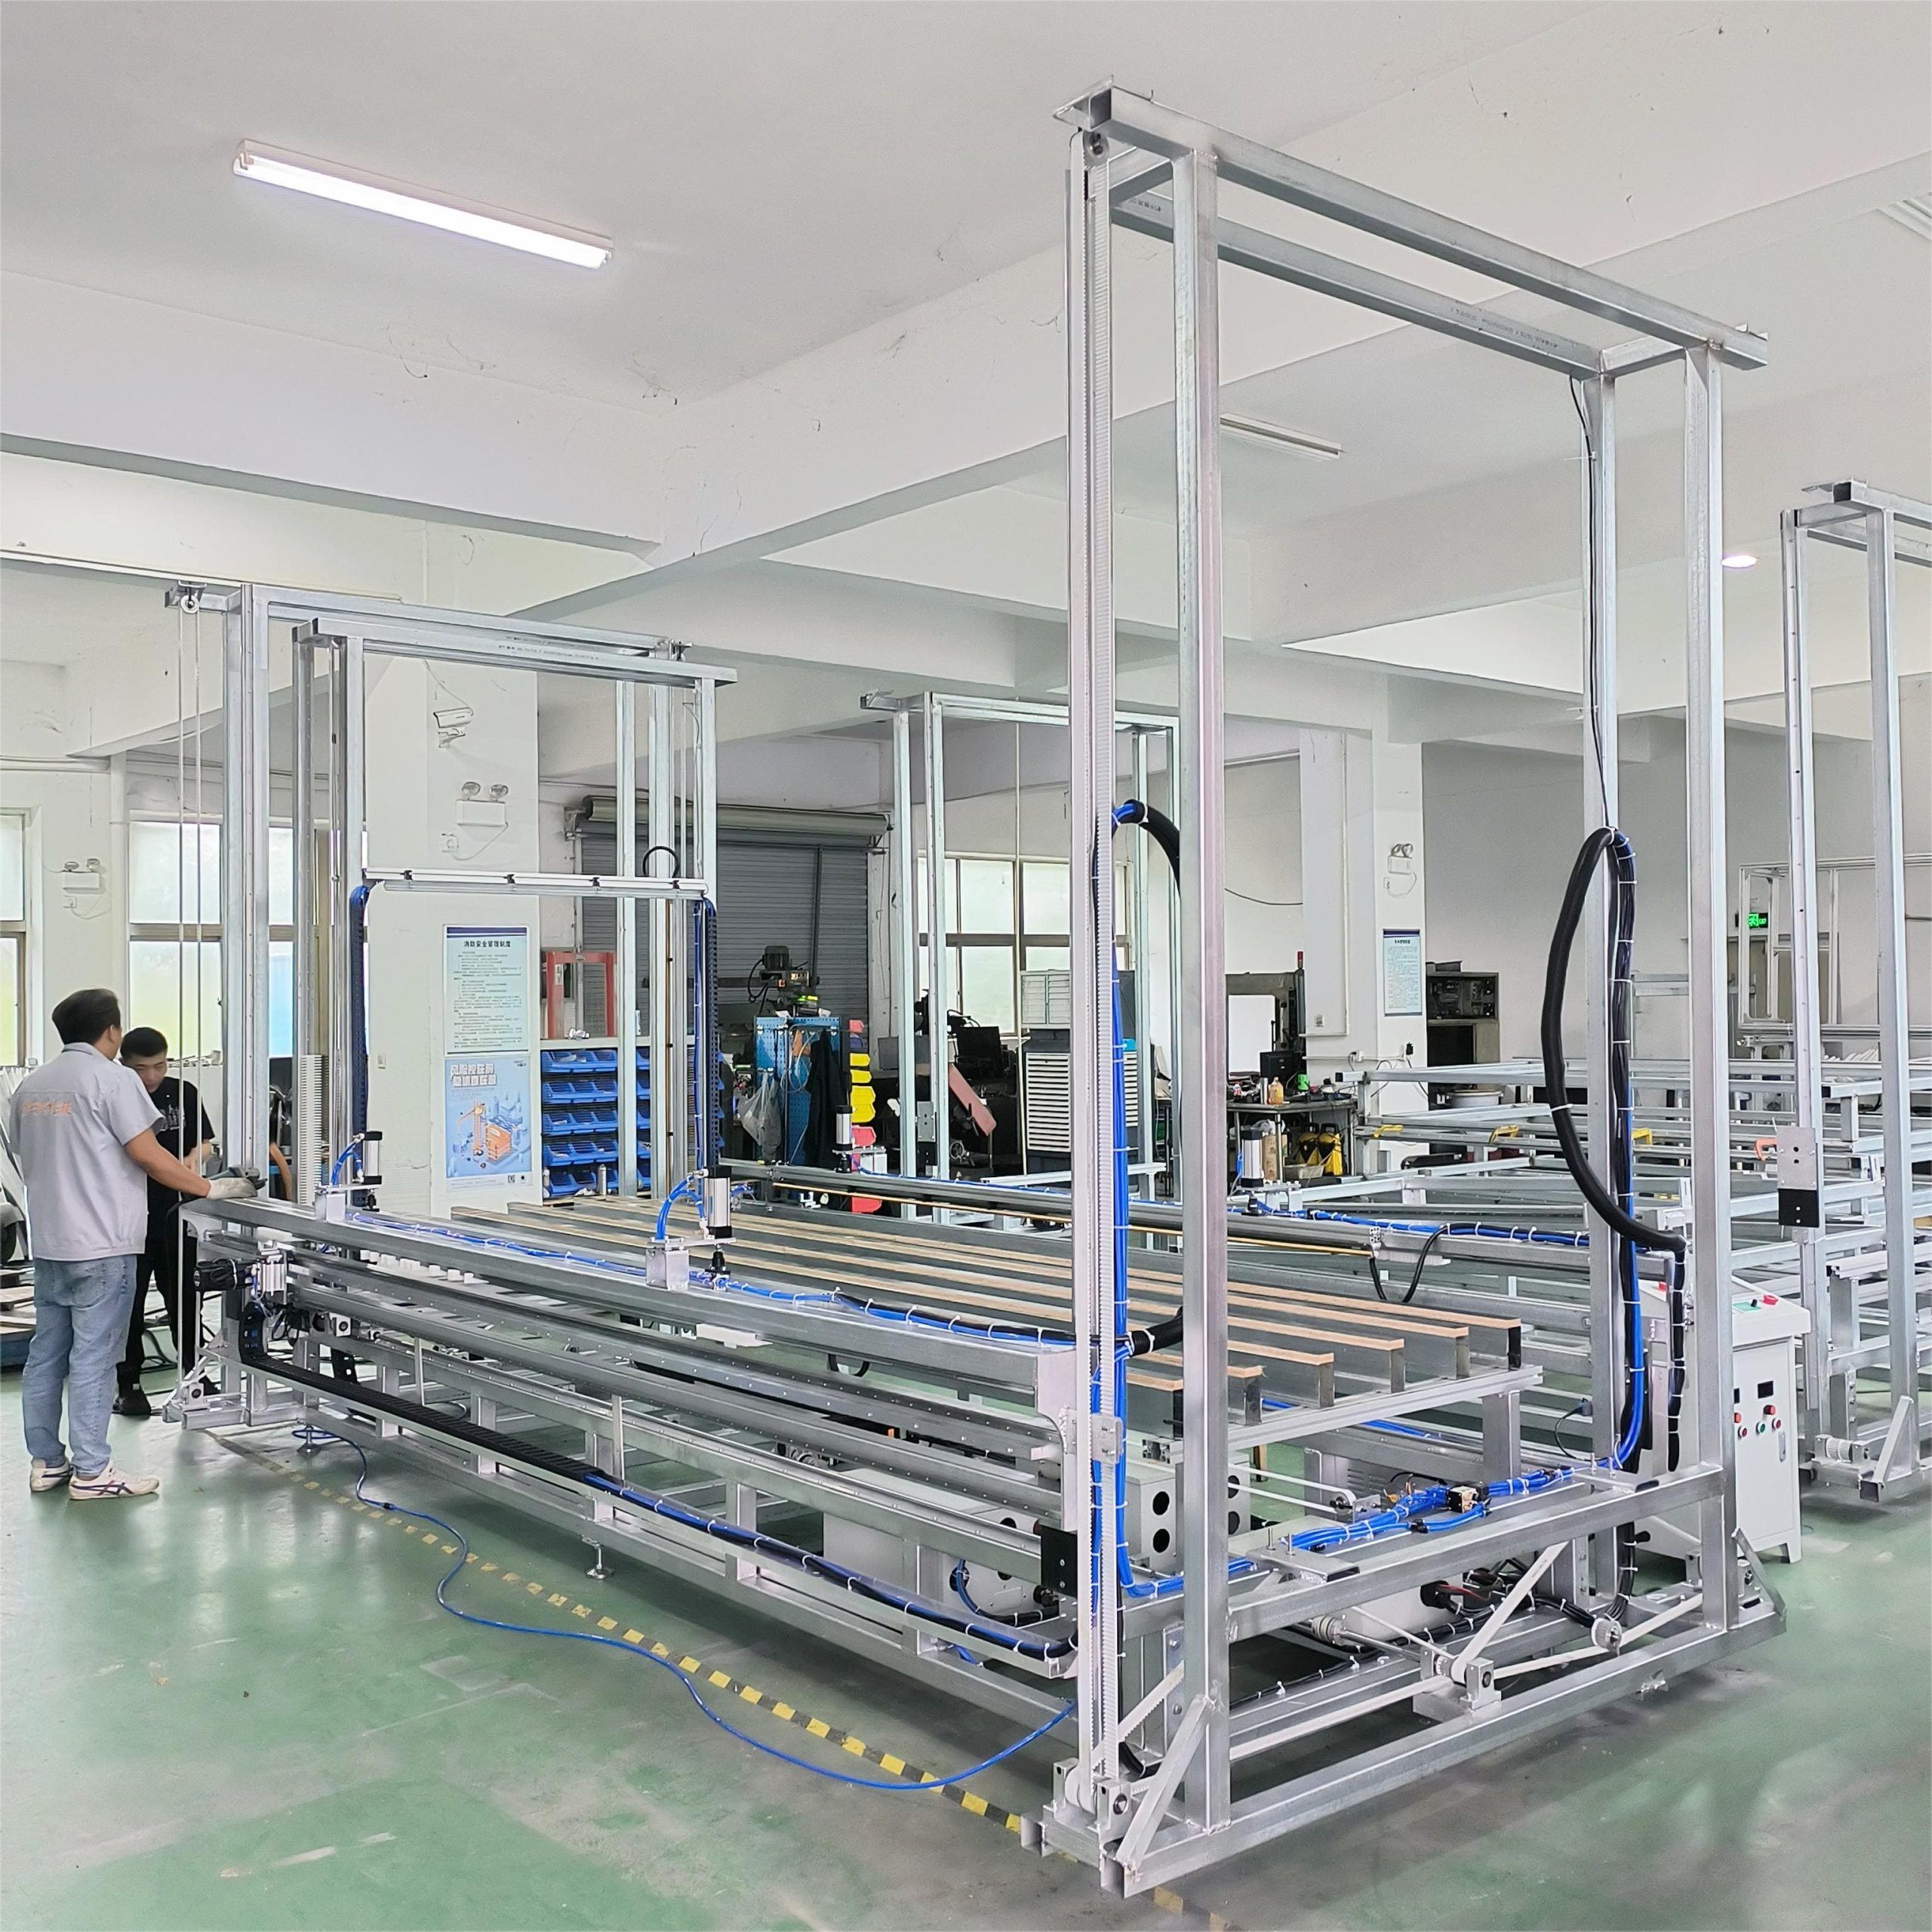
An EPS factory does not have one universal electricity, steam or water figure. Utility use changes with product density, machine size, cycle recipe, shifts, utilization, cooling method, condensate return and reject rate. The defensible estimate starts with every machine's measured or supplier-confirmed demand, places that demand on a time profile, and divides the result by saleable output. Installed kilowatts are not kilowatt-hours; daily steam is not peak boiler demand; circulating cooling water is not fresh-water consumption.
This guide gives factory owners a calculation method for an EPS block, board or molded-packaging line. It uses published ChinaEps machine data only where named and labels the worked figures as assumptions. Use the method for budgeting and supplier comparison, then have local electrical, boiler, water-treatment and safety professionals approve the final design.
Three numbers for each utility
Record connected capacity for infrastructure, peak simultaneous demand for generators and pipework, and consumption per shift or per saleable unit for operating cost. Mixing these three is the most common reason utility budgets are wrong.
EPS Production Line Utilities at a Glance
| Utility | Capacity question | Consumption question | Useful KPI |
|---|---|---|---|
| Electricity | What is the maximum coincident running and starting load? | How many kWh are used during the shift? | kWh per m³ or per 1,000 molded parts |
| Steam | What kg/h peak reaches the machines at the required pressure and dryness? | How many kilograms of steam are generated per shift? | kg steam per m³ or per 1,000 parts |
| Water | What instantaneous flow and heat-rejection duty must the loop handle? | How much fresh makeup and discharge occur per shift? | m³ makeup per m³ or per 1,000 parts |
| Compressed air | What peak free-air delivery and pressure are required? | How many compressor kWh does the shift consume? | kWh per saleable unit and leak percentage |

How to Calculate EPS Factory Electricity Consumption
Electricity per shift is the sum of each load's measured running power multiplied by its operating hours. The nameplate or installed power is a design ceiling, not proof that the machine draws that amount continuously. Heaters, pumps, vacuum systems, blowers, conveyors, cutting wires, air compressors, cooling-tower fans, lighting and office loads all have different duty cycles.
For an early estimate, use:
Shift electricity (kWh) = Σ installed kW × running-load factor × operating hours
Then add measured non-production loads and distribution losses as separate rows. Do not hide them inside an arbitrary percentage. A motor's starting current also affects transformer, generator and protection design even though the short start contributes little to the energy bill.
Published equipment values provide an audit starting point. The PE-1400 batch pre-expander lists 30 kW installed power; the BM-1200 block molder lists 20 kW; the SM-1200 shape molder lists 25 kW; and the SPQ-A cutting line lists 32 kW wire-heating plus 11 kW motor power. Those values must not simply be added and multiplied by 24 hours. Record when each subsystem actually runs and validate it during the factory acceptance test.
Illustrative electricity calculation for one 8-hour shift
| Load | Published/assumed basis | Illustrative duty | Shift energy |
|---|---|---|---|
| PE-1400 pre-expander | 30 kW installed | 3 h at 75% of installed load | 67.5 kWh |
| BM-1200 block molder | 20 kW installed | 8 h at 70% | 112 kWh |
| SPQ-A cutting line | 43 kW installed heating + motor | 6 h at 80% | 206.4 kWh |
| Air, water and handling auxiliaries | 20 kW illustrative connected load | 8 h at 60% | 96 kWh |
| Illustrative total | Not a guaranteed plant figure | 481.9 kWh/shift | |
If that shift releases 80 saleable cubic metres, the example KPI is 6.0 kWh/m³. If it releases 60 m³ after rejects and downtime, the same 481.9 kWh becomes 8.0 kWh/m³. That is why the denominator must be saleable production, not theoretical machine capacity. Replace every illustrative load factor and output with logged data from the proposed recipe and shift plan.
How to Calculate Steam Use and Boiler Peak Demand
Steam is normally the most time-sensitive EPS utility. Pre-expansion, block molding and shape molding draw steam in pulses. A daily total estimates fuel and treated-water cost, while the highest credible overlap in kg/h sizes the boiler, accumulator, header and pressure-control system.
For each recipe, calculate:
Shift steam (kg) = steam per batch or cycle × completed batches or cycles
Peak steam (kg/h) = Σ active machine steam rate during the design overlap
The published PE-1400 figure is 80–100 kg per batch. The BM-1200 lists 30–40 kg per cycle, and the SM-1200 lists 8–15 kg per cycle depending on product mass. Use the actual model, mold, density and recipe; do not transfer these numbers to another machine. For detailed pressure, simultaneity, margin and condensate logic, use the EPS boiler sizing method.
Illustrative steam schedule—not a boiler recommendation
Assume one shift completes 18 PE-1400 batches at 90 kg/batch, 60 BM-1200 cycles at 35 kg/cycle and 80 SM-1200 cycles at 12 kg/cycle. Process steam is:
- Pre-expansion: 18 × 90 = 1,620 kg
- Block molding: 60 × 35 = 2,100 kg
- Shape molding: 80 × 12 = 960 kg
- Illustrative process total: 4,680 kg/shift, before distribution, startup, warm-up and other verified losses
The average is 585 kg/h over eight hours, but that does not mean a 585 kg/h boiler is adequate. If several machines open steam valves together, the short peak can exceed the average substantially. Build a one-minute or cycle-by-cycle load chart, consider justified cycle staggering, then check pressure at the most remote machine under the design overlap. Boiler output at the site's fuel, altitude, feedwater temperature and water quality also needs confirmation.
How to Calculate Water Use Without Counting the Same Water Twice
Separate circulating flow from fresh-water consumption. Cooling pumps may circulate a large flow through molds, heat exchangers, vacuum systems or a cooling tower, but a closed or recirculating loop reuses most of that water. The purchased-water budget is driven by initial fill, evaporation, drift, blowdown, leakage, cleaning and water carried out with condensate or product.
Use two calculations:
Cooling-loop capacity = required flow at design supply temperature and pressure
Fresh makeup = evaporation + drift + blowdown + leaks + cleaning + unrecovered losses
For an open cooling tower, evaporation follows rejected heat and weather; blowdown depends on incoming water chemistry and the permitted cycles of concentration. For a closed-loop chiller or dry cooler, the makeup may be lower but electricity demand can be higher. Vacuum pumps may be water-ring, dry or centrally supplied, and each architecture changes both water and power use. Ask suppliers for flow, inlet temperature, allowable temperature rise and water-quality limits—not only a tank volume.
The U.S. EPA's cooling-tower water-management guidance recommends tracking makeup, blowdown and cycles of concentration. For the electrical balance, include the compressor as a production load and manage leakage; the U.S. Department of Energy's compressed-air sourcebook provides an industrial measurement and maintenance framework. These references support the accounting method; they do not replace the machine supplier's flow and pressure data.
Steam and water accounts must also reconcile. Every kilogram of boiler feedwater becomes steam, condensate or loss. Returning hot, clean condensate reduces makeup-water treatment and fuel required to heat cold feedwater. Meter boiler makeup and condensate return separately; otherwise a steam leak, failed trap or cooling-water overflow can disappear inside one monthly water bill.
Build a Utility Matrix Before Asking for a Quotation
| Machine/area | Operating state | Electricity | Steam | Water | Evidence |
|---|---|---|---|---|---|
| Pre-expander | Warm-up, production, discharge, idle | Installed kW, measured running kW, start method | kg/batch, pressure, batch duration | Flow, temperature, discharge | Model data + FAT meter |
| Molder(s) | Fill, steam, cooling, eject, changeover | Running and peak kW by phase | kg/cycle and valve-open profile | Circulating flow and makeup | Loaded-cycle test |
| Cutting/finishing | Standby, cutting, conveying | Heater and motor kW by recipe | None unless process-specific | Normally none unless specified | Supplier test sheet |
| Central utilities | Production, standby, regeneration | Compressor, pumps, fans, treatment | Boiler auxiliaries and losses | Makeup, blowdown and cleaning | Metered balance |
The matrix should show normal, maximum and startup conditions, not one brochure value. Put the same machine schedule into the factory layout review so transformer location, steam-header length, condensate fall, cooling equipment, drains and future tie-ins are coordinated before civil work.
Five Utility-Budget Mistakes to Avoid
- Treating installed kW as continuous consumption. This overstates some loads while missing compressor, pump, lighting and standby energy.
- Sizing steam from the daily average. EPS machines pulse. Peak overlap and pressure at point of use control performance.
- Calling circulating flow “water consumption.” Quote loop flow and fresh makeup separately, with the cooling architecture stated.
- Using theoretical output as the denominator. Changeovers, warm-up, rejects and downtime consume utilities without producing saleable material.
- Accepting an estimate without test conditions. Density, mold, cycle, ambient temperature, inlet-water temperature, voltage and operating hours must travel with every number.
What to Send for an EPS Factory Utility Estimate
- Final products, dimensions, target densities, daily saleable output and shift pattern.
- Machine list and models, mold cavities, block dimensions, recipes and expected cycle times.
- Production calendar: which machines run together, warm-up time, changeovers and planned expansion.
- Site voltage, frequency, transformer or generator limits and local electricity tariff structure.
- Fuel type, available boiler pressure, feedwater temperature, water analysis and condensate-return plan.
- Summer design wet-bulb/dry-bulb conditions, incoming-water temperature and discharge restrictions.
- Required estimate format: connected load, peak demand, daily consumption and per-unit KPI.
Utility CTA: send ChinaEps your product mix, target densities, daily output, shifts, proposed machine list and site utility conditions. Our production-line team can prepare a model-by-model load schedule for your local electrical, boiler and water-system engineers to verify. Request an EPS utility schedule →
Frequently Asked Questions
How much electricity does an EPS production line use?
There is no reliable line-wide figure without a machine schedule. Sum measured running kW multiplied by hours for each machine and auxiliary, then divide shift kWh by saleable m³ or parts. Use installed kW plus starting data for infrastructure sizing, not for the energy bill.
Is steam consumption the same as boiler capacity?
No. Consumption is the kilograms used over a period; boiler capacity must cover the credible simultaneous peak at the required pressure, plus only justified allowances. Distribution pressure drop, warm-up and condensate return also matter.
Does an EPS factory consume all of its cooling-water flow?
No. A recirculating system reuses cooling water. Pump flow sizes the loop, while fresh consumption is the makeup needed for evaporation, drift, blowdown, leakage, cleaning and other losses.
Which machine normally drives peak steam demand?
It depends on the installed line and cycle overlap. Block and shape molders often create sharp pulses, while a pre-expander adds batch demand. Plot every valve-open period rather than assuming one machine always dominates.
Should utilities be quoted per tonne of EPS resin?
Only with density and product mix stated. One tonne expanded to 10 kg/m³ occupies twice the volume of one tonne at 20 kg/m³, so molding, handling and cutting duty differ. Per m³ or per 1,000 parts is often more actionable, with resin tonnes retained for material accounting.
How can a factory verify supplier utility claims?
Put test conditions and acceptance points in the contract. During a loaded FAT or commissioning run, log machine power, cycles, steam or condensate mass where practical, loop temperatures, makeup water and saleable output. Compare the same recipe and time boundary promised in the quotation.
The Planning Decision
Do not ask only “How much does an EPS factory use?” Ask what the plant must connect, what can peak at the same moment, and what it consumes per saleable unit. A time-based utility matrix turns a generic estimate into transformer capacity, boiler duty, pipe sizes, cooling duty and an operating-cost model that local engineers can check.